
Franchise Signal Scored 200+ FDD Item 19 Financials - What Was Disclosed?
Franchise Signal scored 200+ franchise brand filing documents to produce one number... what percentage of each franchised system was disclosed in Item 19?
Item 19 of a Franchise Disclosure Document is where a franchisor discloses the financial performance of its franchisees and overall system.
- How much revenue did the best performing location make? What about the worst performing location?
- What were the median and averages?
- What would a new franchisee reasonably expect to make? What kind of costs are associated with running the business? What are actual earnings and take home after all costs, upgrades, improvements, debt service?
- How many locations were included in the Item 19 representations? If a unit closed was it included? Why else might a unit not be included in Item 19?
As a prospective franchisee, investor, or lender - how much of a system am I looking at in Item 19 of an FDD when I consider these questions?
To answer this, Franchise Signal analyzed 200+ FDDs across multiple filing years to look at one score:
Of all of the franchised units that operated during any part of the filing year ... what percentage did the franchisor include and provide revenue based outlet metrics on in its FDD?
The results of this analysis are outlined below with highlights from the data.

Key Findings:
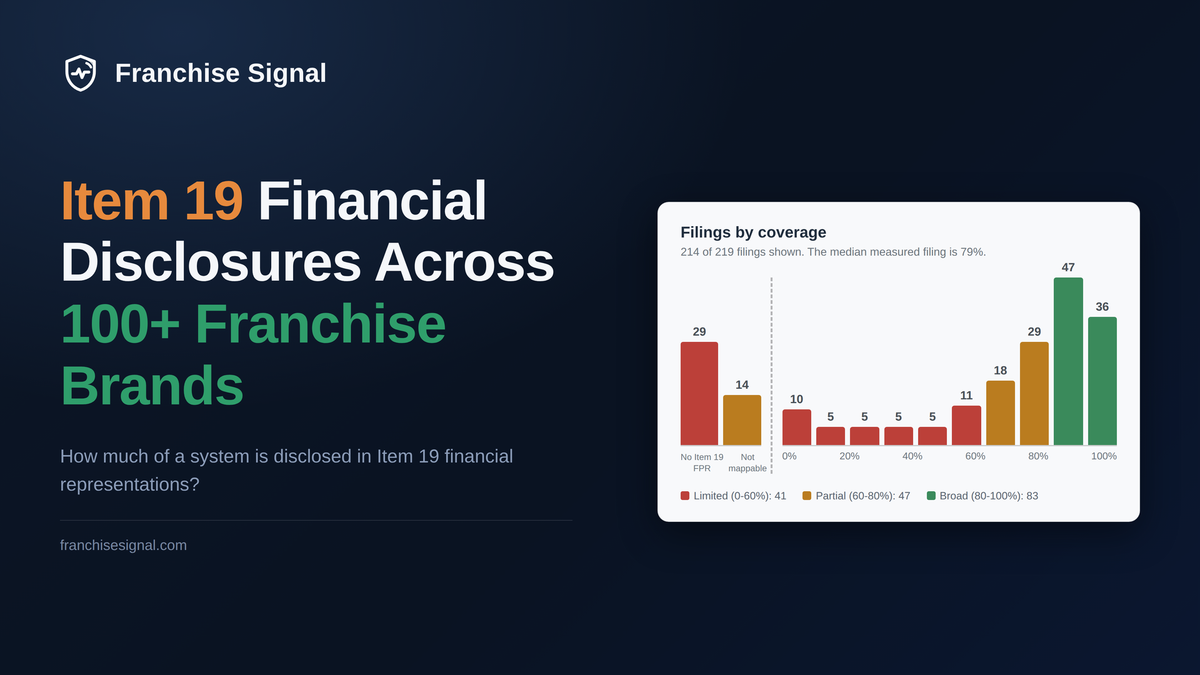
- Across all 219 filings, 141,686 of 245,687 operated franchised outlet-years have disclosed per-outlet revenue: 58%.
- 29 filings contain no Item 19 representation. These filings account for 61,300 operated franchised outlet-years.
- 8 filings scored a measured 0% while a franchised base operated.
- 171 of 219 filings display a numeric coverage percentage: 164 scored results and 8 measured 0% results. The other 48 are n/a: (29 with no Item 19 representation, 14 where revenue is bucketed by franchisee rather than by outlet, and 5 first-year systems).
Create an account at Franchise Signal and ask franchise diligence questions within your Claude workspace - all with the added FDD data (across multiple years) for your prospective brand(s). Download FDDs directly for additional research.
What We Scored
This report applies the Franchise Signal Disclosure Score to 219 FDD filings from 138 brands: 59 filings from 2024 editions, 126 from 2025, and 34 from 2026. The score definition is on the Disclosure Score guide.
For each filing, the numerator is the count of franchised outlets whose per-outlet revenue is represented in Item 19, and the denominator is the count of franchised outlets that operated at any point during the year, from Item 20.
This report is not a purely random sample - it was based on brands that have been processed on the Franchise Signal platform.
The full report is available here: https://www.franchisesignal.com/research/state-of-item-19-disclosure-2026
The Five Outcomes
Each filing is classified into one of five outcomes.
Each filing is classified into one of five outcomes. One produces a scored percentage, one produces a measured 0%, and three produce n/a. In total, 171 of the 219 filings display a numeric percentage and 48 display n/a. The counts and the operated outlet-years in each outcome:

A measured 0% and an n/a are reported as different outcomes.
Scored: 164 filings (75%). A franchised revenue population maps to the outlet base and a percentage is computed. Range: 0% to 100%. These filings account for 179,804 operated franchised outlet-years, of which 141,686 (79%) have disclosed per-outlet revenue.
No Item 19 representation: 29 filings (13%). The FDD makes no financial performance representation. An Item 19 representation is optional under the Federal Trade Commission Franchise Rule. These filings account for 61,300 operated franchised outlet-years with no disclosed performance data. The largest system in this outcome is Subway (20,972 operating US franchised outlets in the 2024 filing).
Franchised revenue disclosed, not unit-mappable: 14 filings (6%). Item 19 reports franchised revenue averaged by operator, where one operator may run one outlet or several. No individual outlet's revenue can be reconstructed, so the population cannot be reconciled to the Item 20 outlet base and no percentage is computed. These filings report n/a, not 0%, and account for 4,460 operated outlet-years. The largest is Budget Blinds (1,397).
Only affiliate or company revenue shown: 7 filings (3%). A franchised base operated during the year and the revenue figures shown cover only affiliate or company-owned units. The franchised coverage was measured and is 0%. These filings account for 123 operated franchised outlet-years.
First-year systems: 5 filings (2%). No franchised outlet operated during the reporting year. There is nothing to measure, and the result is n/a. One brand in the run moved from this outcome to the affiliate-only 0% outcome the following year, after 26 franchised outlets began operating.
The Low End of the Scored List
Seven scores below 20% coverage are shown below. A low score only states how much of the operating base the figures describe.

The High End of the Scored List
36 scored filings are at 90% coverage or above.

What Does a Disclosure Score Look Like?
To see an example of the score for a given brand, take a look at the Crumbl three-year disclosure report. This report is unlocked - other brands are available for purchase and can be processed on demand.
If you are researching brands, be sure to look at multiple filing years for a given system.
- How has the system grown?
- What contractual terms may have changed in the FDD and what do those changes highlight?
- Have investment figures, fees, or financial performance figures increased? What are the drivers?

How is this Data Compiled? What are the Key Takeaways from this Scoring Process?
Getting to this disclosure score data is not trivial. It involves advanced technical processes for ingestion, extraction, structuring, scoring, and evaluation. None of this is possible without AI.
There is a wide breadth of variability in Item 19 presentation. Some franchise brands may have ten different tables and cohort breakouts. Other brands may only show affiliate performance. Some disclose no data in Item 19. Business models may vary widely and have very different financial drivers a prospective franchisee may be interested in reviewing.
The Federal Trade Commission outlines the specifics of Item 19 presentation. However, as stated, a franchisor does not have to provide financial performance representations.
A franchisor does, however, have to provide in Item 21 its audited financial statements prepared in accordance with GAAP or U.S. Securities and Exchange Commission guidelines - two year balance sheet and three years operations and cash flow.
This variability between Item 19 disclosure guidance and required Item 21 audited franchisor financials is a gap: the revenue breakdown per unit of a franchised outlet often forms the very basis (by way of royalties and/or franchisee fees) of the revenue at the franchisor level. As a result, it could be considered standard practice that a franchisor has a CSV or spreadsheet of every franchised outlet, its open date, its closed date (if applicable) and its sales by year (or a more granular level to match the royalty structure).
As a prospective franchisee, this is an important exercise to think through when looking at any Item 19 and Item 21 and how much of a system is disclosed (and on what basis) in Item 19.
In other words, what are you looking at and basing your models and financial projections on? Is it an affiliate? 10% of a system? Were the closed outlets included in the averages or medians?

What are Next Steps?
If you are researching or underwriting a franchise system, the Franchise Signal Disclosure Score is one more "signal" to add to your diligence process.
If you would like specifics on the scoring, have questions about a specific brand, or want to see additional data - and use any of it right in your AI workspace, take a look on Franchise Signal and reach out to setup a call.
Create an account at Franchise Signal and ask franchise diligence questions within your Claude workspace - all with the added FDD data (across multiple years) for your prospective brand(s). Download FDDs directly for additional research.
Methodology Notes and Limits
The score definition is on the Disclosure Score guide. The numerator counts franchised outlets whose per-outlet revenue is represented in Item 19. The denominator counts franchised outlets that operated at any point during the year, from Item 20.
Activity metrics (per-job sales, jobs per day, recurring-customer rates) do not count toward coverage.
Affiliate and company-owned units are recorded as context and are not counted.
Percentages in this report are rounded to the nearest whole number from the exact numerator-to-denominator ratio, not from intermediate one-decimal displays. Decile buckets in the distribution chart are lower-inclusive: [80, 90) and [90, 100], so a filing at exactly 90.0% counts in the 90-100 bucket.
Portfolio totals sum across brand-year filings, so they count outlet-year observations. 62 of the 138 brands appear in more than one filing year, and an outlet can be counted once per filing year; the 245,687 figure is not a count of distinct locations. The pooled 58% is a size-weighted portfolio statistic: Subway alone contributes 41,540 outlet-years, 16.9% of the denominator, with no disclosed revenue, and excluding it as a sensitivity test raises the pooled rate to 69%. The 138 brands are the brands included in this scoring run, not a random sample and not a census of all franchise systems.
This report and all scores presented measure disclosure breadth only. It is not a measure of business quality, profitability, or investment merit. Figures are computed from each brand's FDD as filed and should be verified against the current source document. Franchise Signal is an independent research platform, is not affiliated with or endorsed by any franchisor, and does not provide legal, financial, tax, or investment advice. Franchise Signal can make mistakes. Verify against the FDD and consult qualified professionals before making any franchise investment decision. This report is for informational purposes only and does not constitute legal, financial, or investment advice. All figures should be verified against the source documents.


Comments ()